
blog
14.5% Replies, Worst Follower Yield in an Organic Growth Loop
August 30, 2026 · 8 min read · Scout7
A ten-day ledger shows why Instagram can win conversation and lose audience growth, and how to assign each platform one job.
Subtitle: A ten-day ledger shows how to choose B2B SaaS social platform selection by conversation value versus audience efficiency.
Read time: 5 min
Why one platform can win replies and lose growth
If your Instagram activity gets real replies but barely moves follower count, nothing is broken. In one ten-day organic growth loop, Instagram produced the strongest author conversation rate and the weakest follower efficiency at the same time, which means social media ROI for SaaS needs two columns, not one score.
Key takeaways:
- Instagram won conversation with a 14.5% author-reply rate
- Threads won audience growth at 4.3 writes per follower
- Same effort, same window made platform differences easier to trust
- Each channel needs one job before you change budget
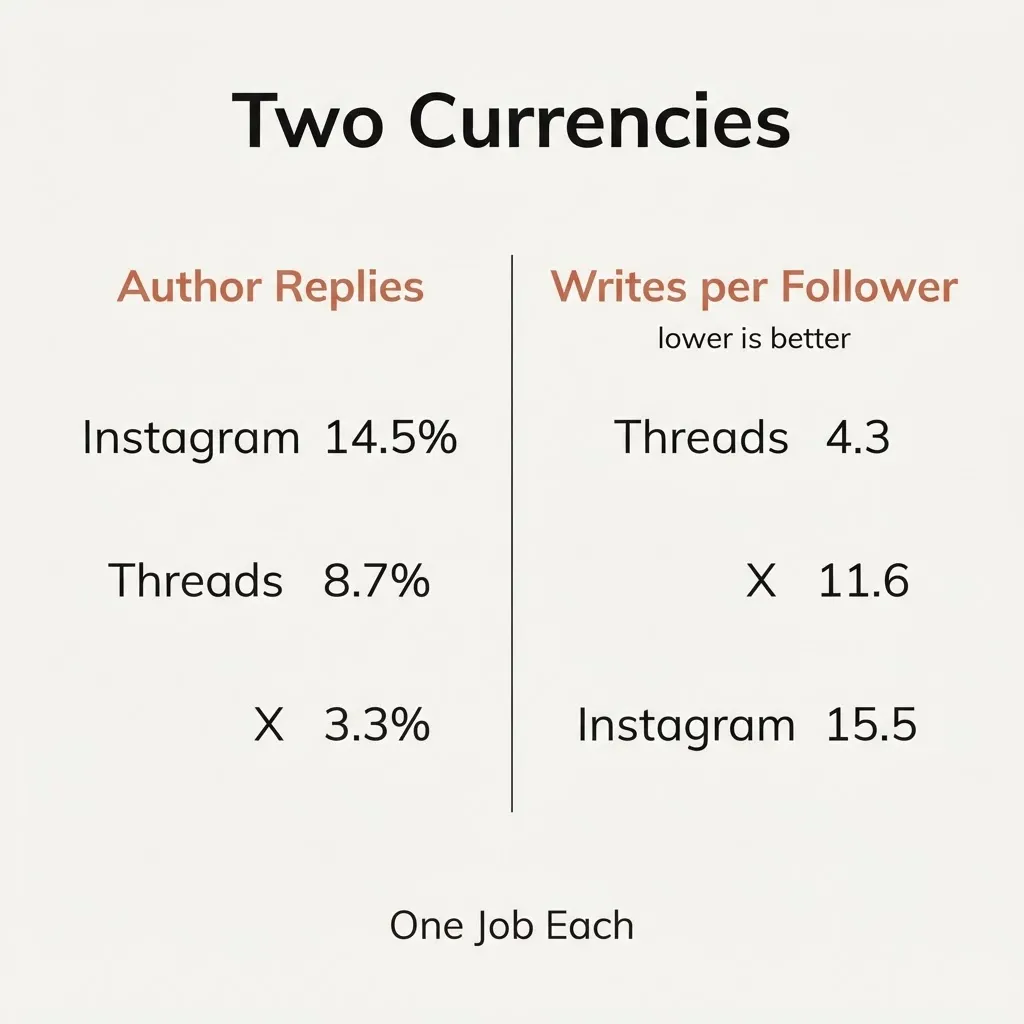
Instagram post authors replied to our comments at about 1 in 7 threads (14.5%), while X returned about 1 in 30 (3.3%). Both numbers are ours, counted the same way, in the same ten-day window.
And yet Instagram gave us our worst follower yield: one follower per 15.5 comments, versus 4.3 on Threads and 11.6 on X, using the same ten days of work.
That tension is the whole point. The platform that talks back is not always the platform that grows your audience, and that is exactly why B2B SaaS social platform selection breaks when every channel gets judged by follower count alone.
The rest of this piece gives you the ledger we used so you can audit channels by what they actually return.
Ten days, 949 comments, nine platforms

That contradiction only matters if the setup was controlled. So we held the work steady and let the platforms vary.
We ran one agent across nine platforms for ten days, wrote 949 comments, watched 791 threads, and started every account at zero followers.
Every figure in this piece comes from one source: Scout7's own engagement ledger for that ten-day window — our post-by-post log of what the agent wrote and what came back. There is no third-party study behind these numbers, and none is needed; they are counts of our own work.
Based on what we saw when the same agent, playbook, timing, and zero-follower starting point were held constant across platforms, the spread mostly described platform shape rather than changing execution.
The main three platforms looked like this:
- Instagram: 263 comments written | 14.5% author-reply rate | 15.5 writes per follower
- X: 313 comments written | 3.3% author-reply rate | 11.6 writes per follower
- Threads: 264 comments written | 8.7% author-reply rate | 4.3 writes per follower
Underneath those rates: Instagram's 263 comments landed across 227 threads and drew 54 replies, 33 of them from the post author. X's 313 comments landed across 276 threads and drew 31 replies, 9 of them from the author. Instagram gained 17 followers in the window; X gained 27.
This does not prove any platform is universally good or bad.
It does show that when effort, playbook, and starting point stay fixed, the return profile starts to look like a property of the platform rather than a moving target created by your process.
That sets up the real fix: measure the currencies separately.
Two currencies: author replies and writes per follower
Once the run was on paper, the mistake became obvious. We were asking one metric to do two jobs.
For a B2B SaaS team, those jobs are different enough that they need separate lines in the ledger:
- Author-reply rate: post author replies divided by threads commented on
- Writes per follower: comments written divided by followers gained in the same window
- Threads watched: context for sample size beside both metrics
- Lower writes per follower: better audience efficiency
- Higher author-reply rate: better conversation yield
Here is the copyable ledger — effort first, then the two currencies:
A platform can be a conversation machine and a weak audience machine at the same time.
- Instagram: 263 writes | 14.5% author replies | 15.5 writes per follower
- X: 313 writes | 3.3% author replies | 11.6 writes per follower
- Threads: 264 writes | 8.7% author replies | 4.3 writes per follower
- YouTube: 25 threads | 8.0% reply rate | 0 author replies
- Reddit: 14 threads | 42.9% reply rate | directional only
- IndieHackers: 10 threads | 40.0% reply rate | directional only
The Threads row is the one that stops cherry-picking. You cannot compare Instagram to X on replies, then Instagram to Threads on follower efficiency, and call that a ranking.
The bottom three rows are a different shape on purpose. Fourteen threads on Reddit and ten on IndieHackers are too few to rank against Instagram's 227 or X's 276, so they sit in the ledger as directional readings only — worth another window, not worth a budget decision.
So the next step is not to crown a winner. It is to assign a job.
Give every platform one job in the organic growth loop

Once the ledger separated conversation from audience, the decision got simpler. We stopped asking each channel to be everything.
In our run, the platform jobs became clear:
- Instagram got the conversation job because author replies were strongest
- Threads got the audience job because follower efficiency was best
- X was capped until it earned a clearer role
- Small-sample channels stayed experimental until they had enough volume
- Budget followed the job, not a blended vanity score
This is the practical answer to how to choose the right social platform for B2B SaaS growth. Match each platform to the return it actually pays.
If a platform creates high-intent conversation but weak audience growth, judge it on conversation. If it creates scalable audience growth but weak dialogue, judge it on audience efficiency.
In this ledger, Instagram was not a trap. It was just mis-scored.
And the follower side stayed just as clear. Instagram needed 15.5 writes per follower; Threads needed 4.3. The same hour of the same work bought roughly three and a half times more audience on one channel than the other.
That still leaves one uncomfortable gap: clicks.
What we could not see
This is the part that keeps the rest honest. The cleanest numbers in the run were not the whole funnel.
Only Instagram’s bio link was tagged, and it logged 12 visits over six weeks.
Meanwhile, Threads and X accounted for 577 writes combined, but their bio links were untagged, so their click-through data was invisible rather than absent.
That distinction matters for social media ROI for SaaS:
- An untagged link is not a measured zero
- Follower growth does not equal demand creation
- Conversation does not equal traffic without instrumentation
- Roughly 69% of organic arrivals carried no referrer at all
- The next run needs UTM tags on every profile bio link
It also caps how far this ledger can be pushed. It ranks channels on conversation and on audience efficiency, because those are the two things we instrumented well enough to compare. It says nothing about which channel sends people to the site, and we should not pretend otherwise until the tags are on.
So before you decide which channel drives pipeline, tag links, rerun seven days, and read the ledger again.
Run the ledger, not the scoreboard

Key takeaways:
- Conversation and growth are separate currencies
- Instagram can win replies and lose follower efficiency
- Platform selection improves when each channel has one job
- Instrument links before calling traffic a zero
The opening contradiction holds up at the end: the platform that talked back the most also grew the audience least efficiently. That is not a paradox. It is a measurement problem.
For a SaaS team running an organic marketing loop, the method is simple and repeatable:
- Create one row per platform
- Track author replies, writes per follower, and threads watched
- Assign one explicit job before changing spend or effort
- Cap weak channels and rerun them later
- Retest after proper link tagging
If you are wondering why your Instagram engagement is not turning into followers, the likely answer is that Instagram may be paying you in conversation, not audience efficiency.
If you are deciding on B2B SaaS social platform selection, the safer move is not to copy someone else’s winner. Build a two-column ledger from your own next ten-day window, assign each platform one job, and fund the return you can actually see. That is the cleaner way to run your growth loop from here.
Frequently asked questions
Why did Instagram get the conversation job in this organic growth loop?
Because Instagram produced the highest author-reply rate in the ten-day run. It returned author replies in about 14.5% of threads, which was stronger than both X and Threads in the same window.
Why did Threads get the audience job instead of Instagram?
Threads had the best follower efficiency in the ledger. It needed 4.3 writes per follower, compared with 15.5 on Instagram and 11.6 on X, so the same work produced audience growth more efficiently there.
Does this mean Instagram is bad for B2B SaaS growth?
No. Instagram was mis-scored, not broken. In this run, it was better for conversation than for follower growth, which means it should be judged on the return it actually produced.
Why were Reddit and IndieHackers treated as directional only?
Their sample sizes were too small to rank against the larger platforms. Reddit had 14 threads and IndieHackers had 10, so they stay in the ledger as early signals rather than budget-decision channels.