
first_hand_story
2,001 Views, 29 Taps: The Funnel Math of Instagram Comment Marketing
August 29, 2026 · 9 min read · Scout7
A 28-day Instagram run produced 2,001 views, 574 profile visits, and 29 link taps. Here’s how to measure social funnel conversion honestly.
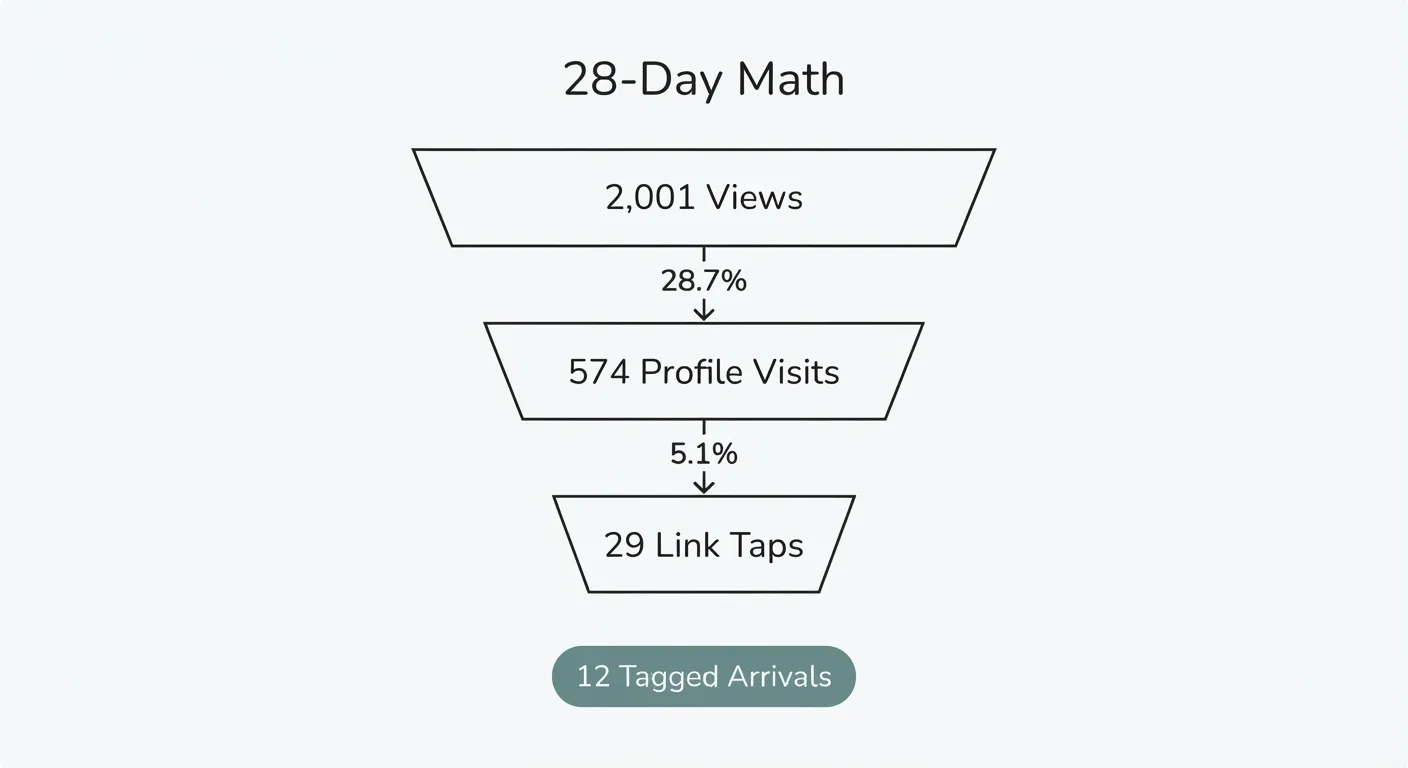
Subtitle: A first-hand Instagram comment marketing run shows how to measure views, profile visits, and link taps honestly over one fixed 28-day window.
Read time: 5 min
AI disclosure: This article was AI-assisted and edited for accuracy by Scout7.
Introduction
2,001 views, 574 profile visits, and 29 external link taps in one 28-day Instagram window is enough to measure a real social media funnel conversion path. For instagram comment marketing, the useful move is simple: track views, profile visits, and external link taps on the same fixed window, then calculate each stage without renaming the numbers.
That was the whole reason this run mattered to me. Once I stopped staring at reach and started reading the ladder, the account stopped looking like vanity and started looking like a usable funnel.
The math from Instagram was straightforward:
- Views to profile visits: 574 / 2,001 = 28.7%
- Views to link taps: 29 / 2,001 = 1.45%
- Views per platform-counted tap: 2,001 / 29 = about 69 views
Those numbers do not prove leads, signups, or customers. They prove that if you keep the labels honest, even a small account can show where interest is forming and where it stalls.
And once that first stage is visible, the next question becomes where the curiosity actually showed up.
Stage One: Feed to Profile, 28.7%
That curiosity showed up in the profile visits. In the same 28-day window, Instagram business insights on @d1nz.3 with 38 followers showed 2,001 views, 550 viewers, and 574 profile visits, all read directly from Instagram.
That means the first stage of the funnel was not just exposure. It was movement from feed to profile.
- 2,001 views became 574 profile visits
- That works out to 28.7% views-to-profile
- 550 viewers produced more profile visits than unique viewers, which suggests repeat inspection behavior
- According to Instagram, 65.8% of views came from non-followers
- According to Instagram, 34.2% came from followers
Most social reporting stops at reach. I think that is where a lot of bad judgment starts, because reach alone cannot tell you whether the content sparked enough curiosity for someone to inspect the profile.
Based on what we saw when we read our own 28-day Instagram business insights and checked them against site analytics, the advantage was not a benchmark rate but a clean measurement method.
But profile visits are still an in-platform action, which is why the next step needs stricter labeling.
Stage Two: Profile to Site, 1.45%

That stricter labeling starts with the number 29. In this run, 574 profile visits produced 29 external link taps, according to Instagram.
Here is the exact stage math:
- Profile visits to link taps: 29 / 574 = 5.1%
- Views to link taps: 29 / 2,001 = 1.45%
- Views per platform-counted tap: about 69
- Platform-counted taps: 29
- Own tagged site arrivals: 12
That last line is the caveat that has to travel with the story every time. Instagram counted 29 taps, but our own site analytics only showed 12 tagged arrivals, so platform-counted taps ran about 2.4x tagged arrivals.
I refuse to smooth that over, because this is where social reporting gets inflated fast. A tap is a real stage in the funnel, but in this run it was not the same thing as a site visitor, and definitely not the same thing as a lead, signup, or customer.
Once I kept that label honest, another split in the data became much more interesting than the tap total itself.
Strangers Watched, Followers Talked
That split was between who watched and who interacted. According to Instagram, non-followers supplied 65.8% of views, while followers accounted for 82.5% of interactions.
That asymmetry says something important about b2b organic growth on social: discovery and conversation may come from different groups.
- Most views came from non-followers
- Most interactions came from followers
- The account had only 38 followers, so discovery extended beyond the existing base
- The interaction pool was 166 total interactions in the same 28-day run
- We have no follower-versus-non-follower split for the 29 link taps
So this section does not prove who visited the site. It only shows that interaction totals alone are not enough to explain down-funnel motion.
If you only looked at comments, likes, or replies, you might think the known audience carried the whole outcome. The view split says that would be too neat.
And then the next obvious question is whether a specific content format did the heavy lifting.
Format Split: Posts Carried Volume, Videos Carried Range
The answer is less dramatic than most format debates make it sound. In this 28-day window, format looked more like a spread story than a winner story.
The view mix broke out like this:
- Posts: 57.2% of views
- Reels: 37.4% of views
- Stories: 5.3% of views
- Carousels and decks: about 12-35 views per post
- Presenter videos: about 83-230 views per post
I would not turn that into “video wins.” The data does not support that claim.
What it does support is the habit of logging range. Some formats gave steadier, narrower outcomes. Others produced wider variance. That matters more than forcing a clean winner label onto a small sample.
This is also why execution is drifting toward automation while measurement still lags. According to Salesforce’s 2026 State of Marketing, 84% of marketers still admit they run generic campaigns, even as AI adoption has become mainstream.
If the spread is the useful insight, the next step is to instrument the same ladder every time.
Instrument Your Own Instagram Comment Marketing in Three Stages
The method is the part worth copying. To measure social media funnel conversion, track views → profile visits → external link taps over one fixed window, then compute the two ratios from the same period.
That turns a vague “bad month” into a located problem.
- Stage 1: profile visits / views
- Stage 2: link taps / profile visits
- Roll-up: link taps / views
- Keep one window: same 28 days for every metric
- Keep labels honest: taps are taps unless site analytics confirm arrivals
In this worked example, 28.7% and 1.45% came from one account, one category, 28 days, and 38 followers. They are not a benchmark.
The broader market is moving toward machine-run execution, but many teams still lack this kind of instrumentation. According to Gartner, marketing leaders expect AI-driven automation to rise from 16% to 36% by 2028. According to Adobe, only 41% of B2B organizations say they have a unified customer data foundation to support AI at scale.
That is the split I care about: let the machine handle continuous measurement, and keep human judgment on voice rules and shipping standards.
Which brings us to the bigger question behind this whole run.
What 28 Days of This Actually Proves
It proves less than social media brag posts usually claim, and more than social media skeptics usually allow. This 28-day run shows that instagram comment marketing can reveal a measurable funnel shape for b2b organic growth, but only at the stages we actually instrumented.
What this run measured, using Instagram, was:
- Views
- Profile visits
- External link taps
- Audience split
- Interactions
- Format distribution
What this run did not measure was revenue, ROI, customer intent by audience segment, or downstream B2B pipeline attribution.
That distinction matters even more now. According to HubSpot’s 2026 State of Marketing, about 48.57% of marketers say AI-powered personalized content is a top trend, and according to McKinsey, high-growth B2B firms are 3x more likely than peers to raise AI investment by double digits year over year.
Key takeaways:
- Measure three stages on one fixed window, not reach alone.
- 29 taps were not 29 visitors in this run.
- Discovery and interaction came from different groups.
- Use rates as diagnostics, not benchmarks.
So does comment marketing work for B2B? Yes, in the narrow and useful sense proven here: it can create measurable movement from view to profile to platform-counted tap, which makes it usable as an organic discovery layer. No, in the inflated sense people often imply: this run does not prove pipeline, revenue, or customer intent.
The opening numbers still hold: 2,001 views, 574 profile visits, 29 external link taps. The value was never that the account was big. The value was that the funnel was instrumented cleanly enough to read.
If you want to diagnose your own social media funnel conversion, pick one fixed 28-day window this month and log those same three stages. Then compare next month’s ladder stage by stage, not by vibe. That is how a social account stops being vanity and starts becoming a usable operating signal.
Frequently asked questions
Is instagram comment marketing the same thing as getting leads from Instagram?
No. In this run, instagram comment marketing showed measurable movement from views to profile visits to platform-counted link taps, but it did not prove leads, signups, customers, or revenue. Taps, confirmed site arrivals and downstream business outcomes are three different things, and they are kept apart here.
Why were 29 taps not 29 visitors?
Because Instagram reported 29 external link taps, while the site analytics only showed 12 tagged arrivals in the same period. That means platform-counted taps were about 2.4x tagged arrivals in this run. The point is to keep labels honest instead of treating every tap like a confirmed visit.
What should I track if I want to copy this measurement method?
Track three stages over one fixed 28-day window: views, profile visits, and external link taps. Then calculate profile visits divided by views, link taps divided by profile visits, and link taps divided by views. Using one window keeps the funnel math clean and comparable month to month.
Did followers or non-followers drive the result?
They played different roles. Non-followers supplied 65.8% of views, while followers accounted for 82.5% of interactions. There is no follower-versus-non-follower split for the 29 link taps, so nothing here claims which group drove the site activity.
References
- Salesforce — State of Marketing 2026
- Adobe — 2026 AI and Digital Trends in B2B Journey Orchestration
- Gartner — Marketing Leaders Expect AI Automation of Marketing Work to Double to 36% By 2028
- HubSpot — 2026 State of Marketing: Data from 1,500+ global marketers
- McKinsey — The Future of B2B Sales: How Growth Champions Rewire Their Playbooks With AI