
case_study
313 Comments on X, 264 on Threads, 263 on Instagram: Threads Won Followers, Instagram Won Replies, X Won Neither — Ten Days of AI Marketing Automation
August 30, 2026 · 8 min read · Scout7
A ten-day case study on Threads vs X vs Instagram shows why B2B SaaS teams need two metrics—not volume—to choose a social platform.
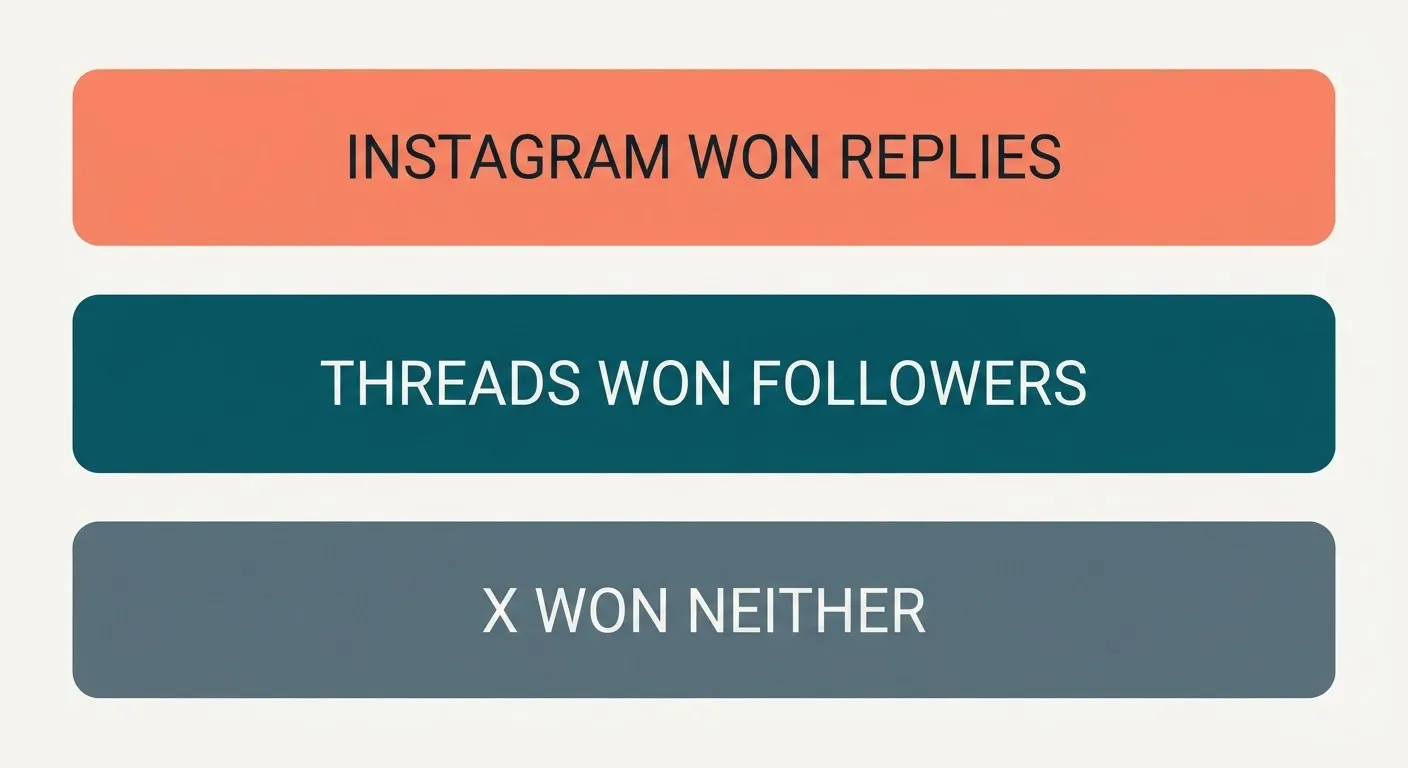
Subtitle: A ten-day case study in AI marketing automation shows why B2B SaaS teams need two columns, not one.
Start with the scorecard, not the platform
If you want the best social platform for B2B SaaS organic growth, the answer from this ten-day test is simple: Instagram won conversation, Threads won audience, and X won neither currency. The mistake is not choosing the wrong platform first; it is choosing with the wrong scorecard.
This case study uses one ten-day ledger only: the same engine, the same window, and three cold accounts that started from zero followers. It gives you a method you can rebuild on your own B2B SaaS social platform accounts.
Key takeaways:
- Instagram won replies and post-author replies
- Threads won follower efficiency by a wide margin
- X used one-third of writes and led neither column
- Two metrics beat volume for organic growth decisions
313 comments on X, 264 on Threads, 263 on Instagram — and the two columns that decided it
And once you stop staring at volume, the budget problem comes into focus.
Over ten days, one engine wrote 313 comments on X, 264 on Threads, and 263 on Instagram across three cold accounts. That was near-identical effort, not identical effort, and X still took the largest share of the write budget.
Based on what we saw when one engine ran for the same ten-day window across three zero-follower accounts, the real problem was not platform hype. It was a bad scorecard.
- X absorbed 313 of 949 writes or 33.0% of total output
- X used about 19% more writes than Threads or Instagram
- In our own ledger, Threads reached 4.3 writes per follower for 62 followers
- X needed 11.6 writes per follower for 27 followers
- Instagram delivered a 23.8% reply rate against 11.2% on X
That is the whole stakes of the test: near-identical effort exposed yield differences that raw output hides.
Currency one: who actually talked back
And if the month’s goal is conversation, the ledger picks a winner fast.
Instagram was first on both reply rate and post-author reply rate. Threads came second, and X was clearly last on this column.
- Instagram: 227 threads, 54 replies (23.8%), 33 post-author replies (14.5%)
- Threads: 218 threads, 46 replies (21.1%), 19 post-author replies (8.7%)
- X: 276 threads, 31 replies (11.2%), 9 post-author replies (3.3%)
- Post-author replies matter more because the original poster chose to engage
- Instagram’s 14.5% post-author reply rate was 4.4x X’s 3.3%
Anyone can get a passer-by reply. A post-author reply is the stronger conversation signal.
On conversation, there is no ambiguity. X finished last.
Currency two: what a follower cost on each platform
But if the month’s goal is audience, the ranking changes immediately.
Threads was the clear winner on follower efficiency. X sat in the middle, and Instagram was worst on this column.
- Threads: 264 writes, 62 followers, 4.3 writes per follower
- X: 313 writes, 27 followers, 11.6 writes per follower
- Instagram: 263 writes, 17 followers, 15.5 writes per follower
- Threads produced 62 followers, more than X and Instagram combined (44)
- Threads outperformed X on follower efficiency by a wide margin
That distinction matters because this is where many write-ups go wrong. X was not worst here. Instagram was.
X won neither currency — which is not the same as losing both
And that is exactly why the wording matters.
The honest claim is narrow and evidence-led: X won neither currency. It did not finish first on conversation, and it did not finish first on audience efficiency.
- X was last on conversation by reply rate and post-author reply rate
- X was middle on audience with 11.6 writes per follower
- Instagram beat X on replies but lost to X on follower efficiency
- Threads beat X on followers but did not beat Instagram on conversation
- Pairing X against different rivals on different metrics is cherry-picking
This is a marketing surface question, not a sweeping verdict on the platform itself. The ledger says only this: X consumed the most output and led neither result column.
A scorecard with one column always produces a decision, and it is arbitrary
 And once you see the split, the common decision error becomes obvious.
Judge platforms by replies alone and Instagram looks like the only rational choice. Judge by followers alone and Threads looks just as obvious.
Both decisions feel clean. Both throw away something valuable.
- Reply-only scorecards would cut Threads, despite 62 followers from zero
- Follower-only scorecards would cut Instagram, despite 14.5% post-author replies
- Single-metric reads feel decisive because they hide the trade-off
- Two columns force the team to define the month’s goal first
- Replies and writes-per-follower are enough to rebuild this method anywhere
This is the transferable lesson. Not our percentages, but the habit of measuring conversation and audience together before moving budget.
The next AI marketing automation experiment, stated so you can copy it
So the next move is not drama. It is reallocation.
Hold total write volume flat at roughly 950 writes for the next ten days. Then move about 100 writes — roughly one-third of X’s budget — toward the currency the month actually needs.
- Need conversations? Move those writes to Instagram
- Need audience? Move those writes to Threads
- Keep the same engine and the same ten-day window
- Change one variable only: where the writes go
- Re-run the same two columns on day ten
One observation explains why the budget drifted to X in the first place: X is the easiest platform to write on at volume, so effort follows friction rather than the ledger. That is probably true in more AI marketing automation workflows than teams admit.
What this ledger does not prove
And the discipline of the method is also knowing what to leave out.
This ledger covers one brand, one ten-day window, and three cold accounts that all started at zero followers. It is a decision aid, not a benchmark for every B2B SaaS team.
- The test is directional, not universal
- Cold-account behavior can differ from mature-account behavior
- Platform mix may vary by category and message style
- Reddit and IndieHackers stayed out of the scorecard on purpose
- Small samples like 6 of 14 threads or 2 of 5 are too thin for budget calls
Leaving flattering numbers out is part of the method. If the sample cannot support a platform decision, it belongs in the notes, not the budget table.
Name the currency before you pick the platform
 Volume was the opening trap, and it is the right place to end.
Key takeaways:
- Instagram wins conversation on replies and post-author replies
- Threads wins audience on writes per follower
- X wins neither currency despite taking the most writes
- Use a two-column scorecard before shifting organic growth budget
Volume is a cost, not a result. In this ten-day case study, the best social platform for B2B SaaS organic growth depended on the currency being measured: Instagram for conversation, Threads for audience.
That is also the clearest answer to how to measure the effectiveness of AI-generated social comments. Measure two outputs from the same write budget: replies and writes-per-follower. In a B2B SaaS social platform test, those two columns tell you whether your organic growth loops are buying conversation, audience, or neither.
For teams running AI marketing automation, that decision rule is more useful than any generic platform hot take. If the month needs replies, fund Instagram. If it needs followers, fund Threads. If a platform wins neither, cap it, shift the mix, and test again after ten days with the same two columns.
Your next step is simple: build a two-column ledger for your own accounts, move one slice of budget, and let the next ten days decide where your organic growth budget goes.
Frequently asked questions
Which platform performed best in this ten-day test?
It depends on the result you care about. Instagram won conversation with the highest reply rate and post-author reply rate, while Threads won audience growth with the best writes-per-follower result. X led neither column.
Why does the article use two metrics instead of one?
Because a single metric hides the trade-off. Reply-only scoring would push you toward Instagram, while follower-only scoring would push you toward Threads. Define the month’s goal first, then judge platforms on both conversation and audience efficiency.
Did X perform worst across every measure?
No. X was last on conversation, but it was middle on follower efficiency. Instagram beat X on replies, while X beat Instagram on writes per follower.
How should a B2B SaaS team apply this to AI marketing automation?
Keep the write budget and time window the same, then move a slice of output toward the platform that matches the month’s goal. If you need conversations, shift writes to Instagram; if you need followers, shift them to Threads. Then rerun the same two-column scorecard after ten days.
Source
Every figure in this article comes from our own engagement ledger: one brand, three cold accounts opened at zero followers, ten days, 949 comments recorded as they were written. No third-party study is used or cited.