
framework
Your B2B Attribution Model Is Half Right. Here Is Which Half.
September 2, 2026 · 11 min read · Scout7
A one afternoon check that scores every row of your analytics for how much you can trust it. You need a spreadsheet and thirty recent signups.
Introduction
You are the only marketing person at your company. Someone asks you, in a meeting, with no warning, whether any of it is working.
You open your analytics. Search looks strong. Direct is large and growing. The blog looks like it did nothing.
You have two ways to answer that question. Together they are your B2B attribution model, whatever tool you keep it in. One is the channel your analytics recorded. The other is what buyers type when you ask them how they found you.
Nobody tells you that these two disagree. They disagree by a different amount on every channel. That is the whole problem.
Here is what this piece gives you. A number you can work out this week, from data you already have. It tells you which rows of your own dashboard you are allowed to argue from.
You need a spreadsheet and thirty recent signups. Nothing else.
If it helps, you are not being slow. The CMO Alliance asked marketing leaders in 2026 how far they trust their attribution data. They rated it 2.8 out of 5. Gartner asked something similar in its Marketing Data and Analytics Survey. It found that 80 percent of marketers struggle to show what their campaigns did. The people with large budgets do not trust these numbers either.
You have two instruments, and they disagree
There are two ways to find out where a customer came from.
The first is tracking. Your analytics records the last thing someone clicked before they signed up. It calls that the channel.
The second is asking. You put a box on your form that says "How did you hear about us?" The buyer types an answer.
Both are flawed. They are flawed in different directions, which turns out to be useful.
Tracking sees the click, not the cause. Somebody reads your article on a Monday. They think about it for three weeks. Then they search your company name and sign up. Tracking records search. The article is invisible to it.
Asking has the opposite problem. It runs on memory. People forget, and people simplify.
Most advice tells you to pick one of these and trust it. That is the mistake.
Point both at the same thirty customers. Then measure how far apart they land.
Your B2B attribution model is not wrong everywhere
Here is the part nobody puts in a headline.
Tracking is not broken evenly. It is good on some channels and close to useless on others. Those numbers sit in the same report, in the same font, and look equally solid.
HockeyStack sells attribution software, so read them with that in mind. They published a report built on 8,528 answers. Every answer came from someone who had just booked a demo. They came from dozens of business software companies. The spread covered North America, Europe and Australia.
They put what the buyer said next to what the tracking recorded. Here is how often the two agreed.
- Social: 60 percent
- Search: 53 percent
- Email: 21 percent
- Display ads: 2.5 percent
Read those four lines slowly.
On social, two separate methods agree about six times in ten. For this problem that is a strong result. Your social number means something.
On display ads they agree once in forty. That is not a small truth. It is close to a coin toss with a spreadsheet around it.
So be fair to tracking. It earns its place. It is free, it is already installed, and it needs nobody's memory. On your two biggest channels it is roughly half right. Half right from two independent directions is a real signal.
Now the rule that falls out of this.
A channel that scores badly is not deleted. It is demoted.
A demoted channel can still be read against itself over time. If display is up on last month, that is probably true. The same error sits in both months, so the direction survives.
It cannot be read against other channels. "Display beat email" is a sentence you are no longer allowed to say.
That one distinction will save you an argument.
Direct traffic means unknown
 Now the row that does the most damage.
Direct traffic does not mean people typed your web address. It means your analytics could not tell where the visit came from.
GA4 files a session as Direct when there is no referrer, no tracking tag and no click ID. Typing the address is a small part of that bucket.
This matters because Direct gets reported upwards as proof of brand strength. MarTech and Analytics Mania both make the same point. When Direct rises, it usually means you lost visibility. It rarely means you gained brand.
It got worse this year. AI assistants send people to your site with no referrer attached. Those visits land in Direct and stay there.
Wheelhouse DMG, an agency, tested this on two client accounts. They compared their raw server logs against GA4. The server logs caught 56 visits from Gemini on iOS. GA4 recorded 5 of them.
They are careful about the limits of their own test, and those limits are worth repeating. Two accounts, one platform, a short window. Enough to show a pattern. Not enough to put a number on it for everybody.
Now put that next to the figure everyone quotes. Conductor sells search and AI visibility software. They measured AI referral traffic at 1.08 percent of all website traffic, across 13,770 company domains and 3.3 billion sessions.
Both things are true at once. 1.08 percent is what could be measured. The instrument doing the measuring is known to miss a lot.
There is a popular fix for this. You add a custom channel grouping that matches referrers like chatgpt.com and perplexity.ai. It works. You should do it.
It also cannot do the thing you need most. A rule can only match a referrer that exists. A visit that arrives carrying none stays in Direct forever.
So the fix is a reading habit, not a tool. Read Direct as "unknown". Then split it by landing page. A new visitor who lands deep inside your site, on one article, did not type that address from memory.
The afternoon check
 Here is the whole method. It takes an afternoon.
Open a spreadsheet. Pull your last thirty demos or signups.
Two columns.
Column one is what the buyer typed when you asked how they heard about you. Their exact words.
Column two is the channel your analytics recorded for that same person.
Go down the list. Mark each row agree or disagree. Then group by channel and count.
Say search was credited with ten signups. Seven of those people also said search. Your search trust score is 70 percent.
That percentage is the point of the exercise. It tells you how much weight that row can carry in a meeting.
- High agreement: you can compare that channel with others.
- Middle: use it, and say out loud that it is rough.
- Low: trend only, never in a comparison.
One detail decides whether this works at all. The box must be free text. Never a dropdown.
A dropdown can only hand back the options you already thought of. You will never find a channel you had not listed. The words people choose are the finding, so let them choose the words.
Be honest about what this costs. In HockeyStack's 8,528 answers, about 20 percent were unusable. Blanks, gibberish, and answers too vague to mean anything. Roughly 2,000 in the bin.
So asking does not replace tracking.
There is a loud argument going round at the moment. Falora, ziellab and Marqeable have each published a version of it. It says attribution is broken, so stop tracking and just ask people.
That swaps one single source of truth for another. You are back to one instrument, and you still cannot check it.
Keep both. The gap between them is the number you came for.
Your best writing is wearing a search costume
 Run that check and one thing will jump out. Your writing will look like it did nothing.
Go back to those 8,528 answers. About 1 percent named content or a blog. Nineteen people, out of eight and a half thousand, named a specific article.
For comparison, podcasts got 0.14 percent. That is twelve people.
The obvious conclusion is that writing does not work. That conclusion is wrong, and it is expensive.
Look at what those buyers did say. Forty-five percent said search.
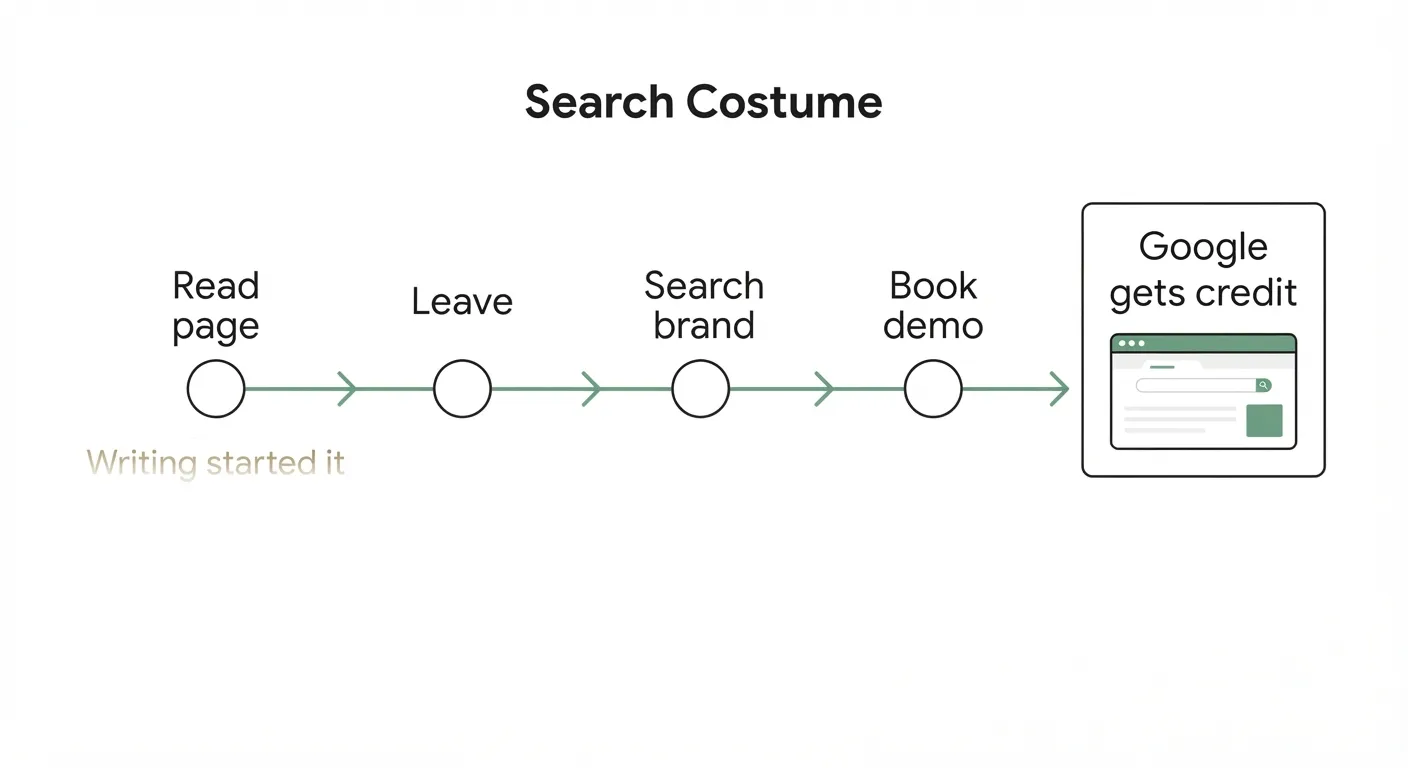
Think about what one of those people actually did. They read your comparison page in March. They thought about it. In May they typed your company name into Google and booked a demo.
Ask them how they found you and they say "Google". They are not lying. Google is the surface they remember. Your page is the thing they do not.
Content is not missing from that 45 percent. It is wearing a search costume.
Eighteen percent said word of mouth. Someone recommended them. A conversation leaves no session to record, so that number can never appear in your tracking at all.
Here is what to do about it.
Stop defending content as a channel. It loses that argument every time. The argument is rigged by how the measurement works, not by how the writing performs.
Ask a different question instead. Of the people who said search, or said a friend, how many had read something of yours first?
Add one line to your form.
"Had you read anything from us before today?"
That question costs you nothing. It is the only one that finds the writing.
What to trust next week
 None of this gives you a clean number. There is not one to get.
What it gives you is a way to know which of your own numbers can hold weight.
Do this next week.
- Pull your last thirty signups.
- Put the buyer's own words next to the tracked channel.
- Count agreement, one channel at a time.
- Mark each row trusted, rough, or trend only.
- Read Direct as unknown, and split it by landing page.
One warning before you start.
Do not move budget because of this. The danger runs the other way, and this is our own view rather than a finding. Money drifts towards whatever measures cleanly. Word of mouth and writing are the two things that can never measure cleanly. Fund only what reports well and you will quietly defund the two things that were working.
A trust score exists to stop a weak number winning an argument. It is not a reason to move money.
That is the method. A spreadsheet, thirty rows and an afternoon, run again whenever someone asks you the question.
There is another way to do all of this. Scout7 runs the whole loop, measurement included, from one command.
Where these numbers come from
- The per channel agreement figures, the 8,528 answers, the 20 percent unusable, the 45 percent search, the 18 percent word of mouth and the 1 percent content: HockeyStack's self reported attribution report. HockeyStack sells attribution software.
- AI referral traffic at 1.08 percent, across 13,770 domains and 3.3 billion sessions: Conductor's 2026 AEO and GEO benchmarks report. Conductor sells search and AI visibility software.
- The server log comparison, 56 visits against 5: Wheelhouse DMG, AI traffic is already in your analytics. Wheelhouse DMG is an agency, and the test covered two accounts on one platform.
- Direct traffic means unknown source: MarTech and Analytics Mania.
- Trust in attribution data at 2.8 out of 5: CMO Alliance CMO Insights Report 2026. Pressure to prove marketing's value: The CMO Survey.
- The argument for dropping tracking in favour of self reporting: Falora, ziellab and Marqeable.
Frequently asked questions
How many signups do I need for this check?
Start with thirty recent demos or signups. That is enough to see where tracking and what buyers say line up, and where they do not.
Should I trust self-reported attribution more than analytics?
No. Keep both. Tracking sees the click. Asking captures what the buyer remembers. The gap between the two is the number you want.
What should I do with channels that score low agreement?
Do not delete them. Demote them. A low-agreement channel can still be read against itself over time, but not compared confidently against other channels.
What does Direct traffic mean here?
Read Direct as unknown, not as proof that people typed your web address. Direct collects any visit with no referrer, no tracking tag and no click ID. Some AI assistant traffic lands there too.